EasyPivot ® Reporting Tool
EasyPivot is a traditional business intelligence reporting tool and can be found at
This is simple and easy to use, and puts the business user in total control of visualisation.
With just a few clicks, EasyPivot lets you consolidate, search, visualize, and analyze all your data for an unprecedented business insight.
Because we have fully developed our own reporting tool, that generates it's own xml generator,
this would save a massive amount of costs without the need for individual licences per organisation.
All reports are up to date with your data, and no more guessing,
just fast visualisation to your most critical business assets.
What EasyPivot means for you:
•Simple to use – Designed for Business taking more control over reporting
•Instant business answers – Explore data without limits. No waiting for static reports.
•Rapid time to value – Measures in days, weeks and months and more.
OUR DASHBOARDS
Search and explore vast amounts of data.
With EasyPivot, you’re not constrained by preconceived notions of how data should be displayed, but can finally understand how quickly and simply producing reports really is. These reports were
built using the automatic xml generator and dynamic SQL queries by a simple button click.
Save time on reports already formatted with the best colours, and knowing your analysts
aren't spending too much time in development.
All too often we see reports without design and usually due to costs
of development, that's why we put all the work and effort into the finished product that's ready to go.
Rather than spending hours or even day's with development, we have also put together the most suitable
report types, so staff can concentrate on their own work making your business
more productive with your assets.
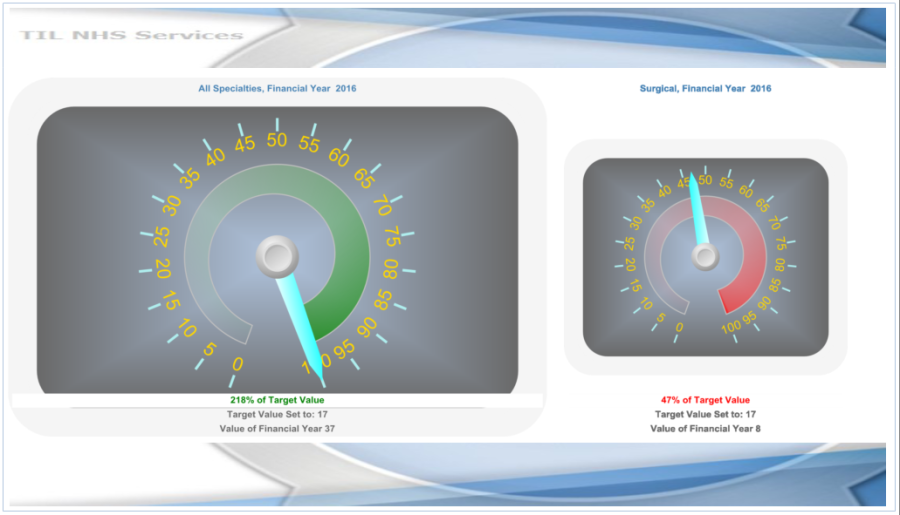
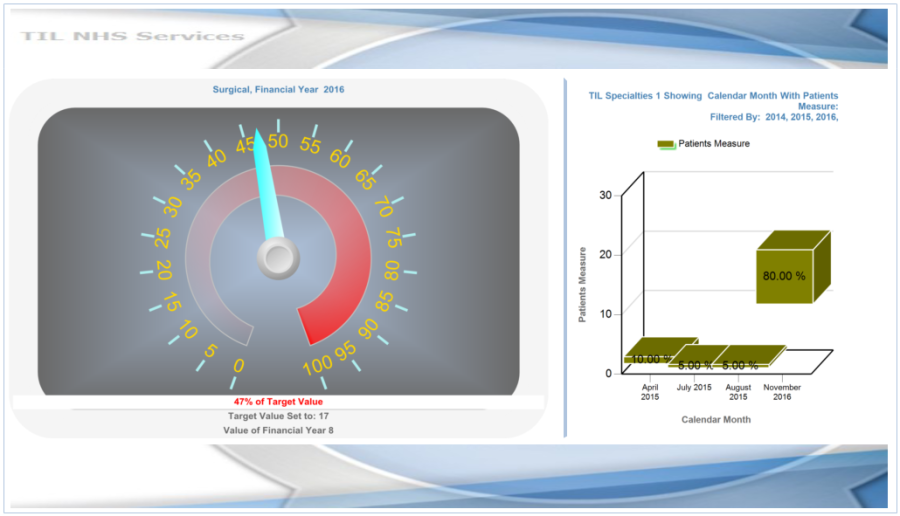
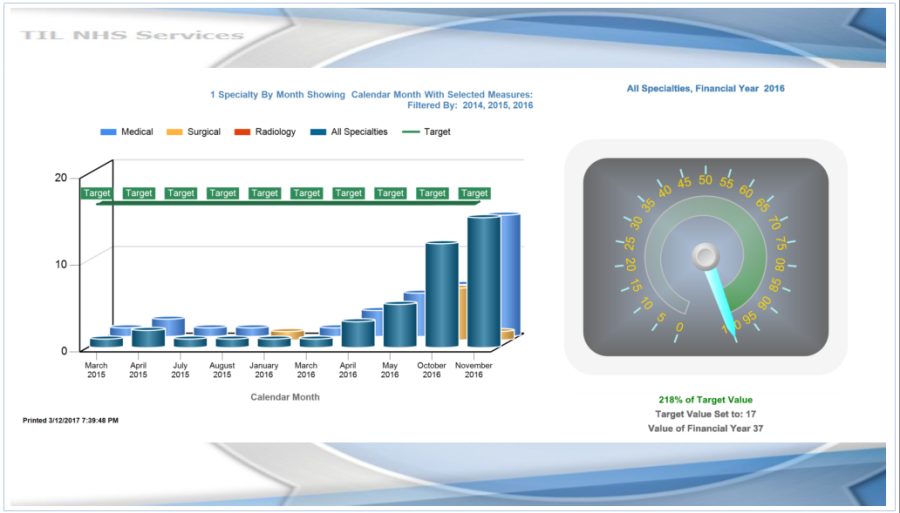 This is a mixture of a chart as well as a dashboard showing the flexiblity of selecting two ready build reports and displaying with the presentation layer already completed.
EasyPivot Reporting provides automatic advanced querying on selections, modelling, and report
features that eliminate the complexity to build data models.
Reports can also be shared to your group peers and saved without the need to go through
your selection ideas time and time again.
All user have their own area so when reports are changed or saved, they are exclusive
to that user.
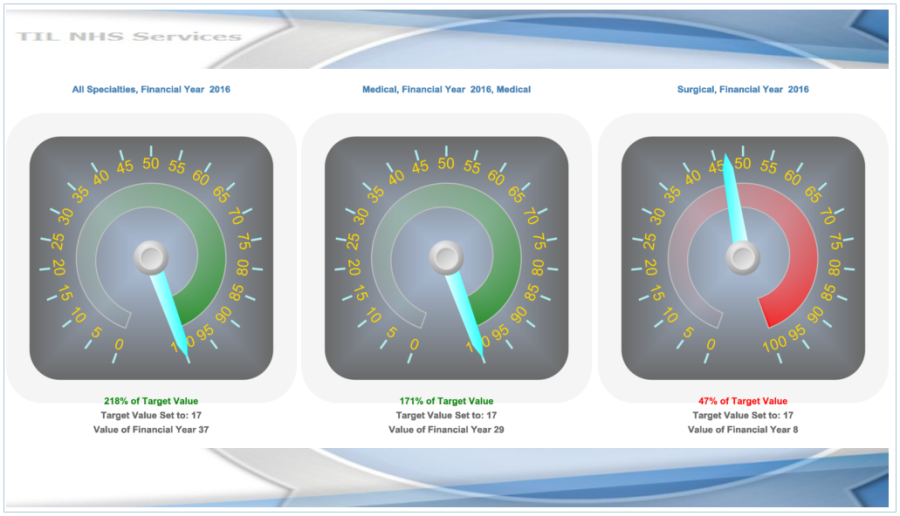
STANDARD CHARTS
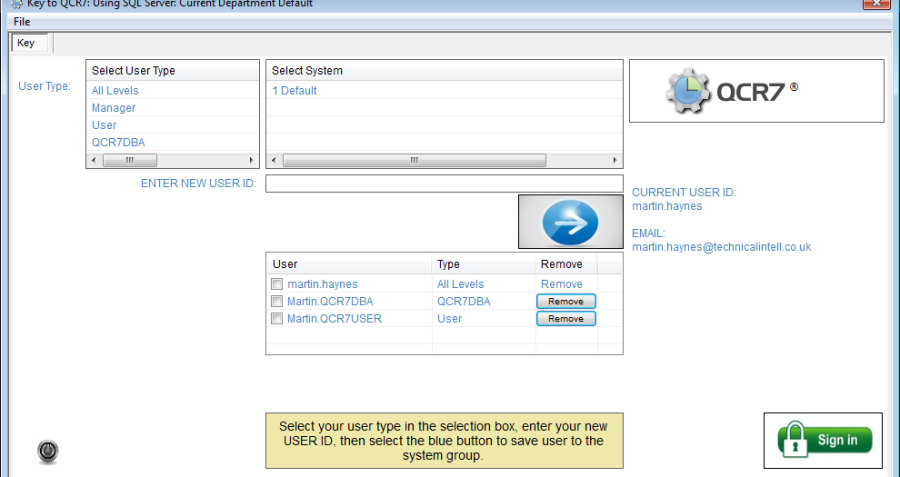
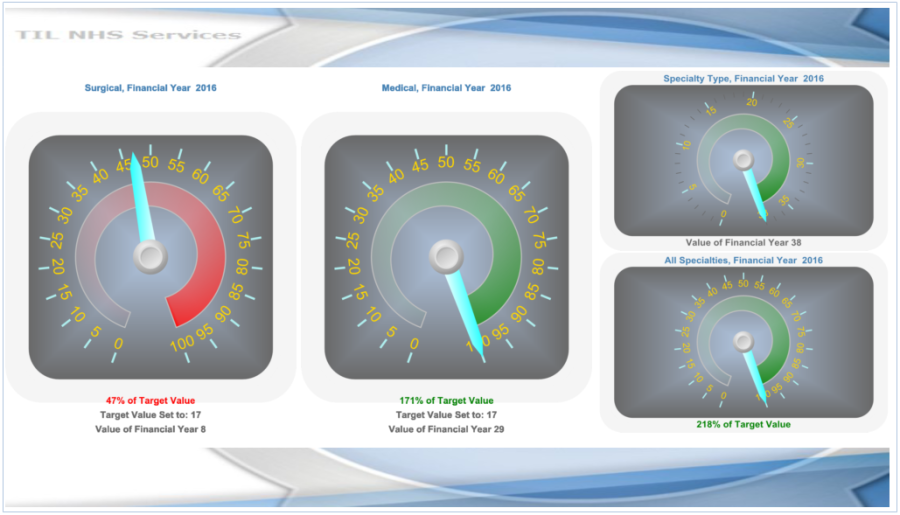
EasyPivot Reporting tool allows you to have a full BI tool for high level reports with drill down methods and our own unique presentation layer.
EasyPivot Reporting tool allows you to have a full BI tool for high level reports with drill down methods and our own unique presentation layer.
Our reporting tool also has features of a personal login area, row level access for individuals if needed and the flexibilty to connect to any dataset
from SQL Server.
Once you've created a report, you can simply click a few buttons to generate a dashboard in your area without the need for specialist IT support. EasyPivot can to connect to your data anywhere and anytime with any up to date web browser with no need for specialists Apps.
NOTE: All data is test data only and no connections to any healthcare